Market Overview
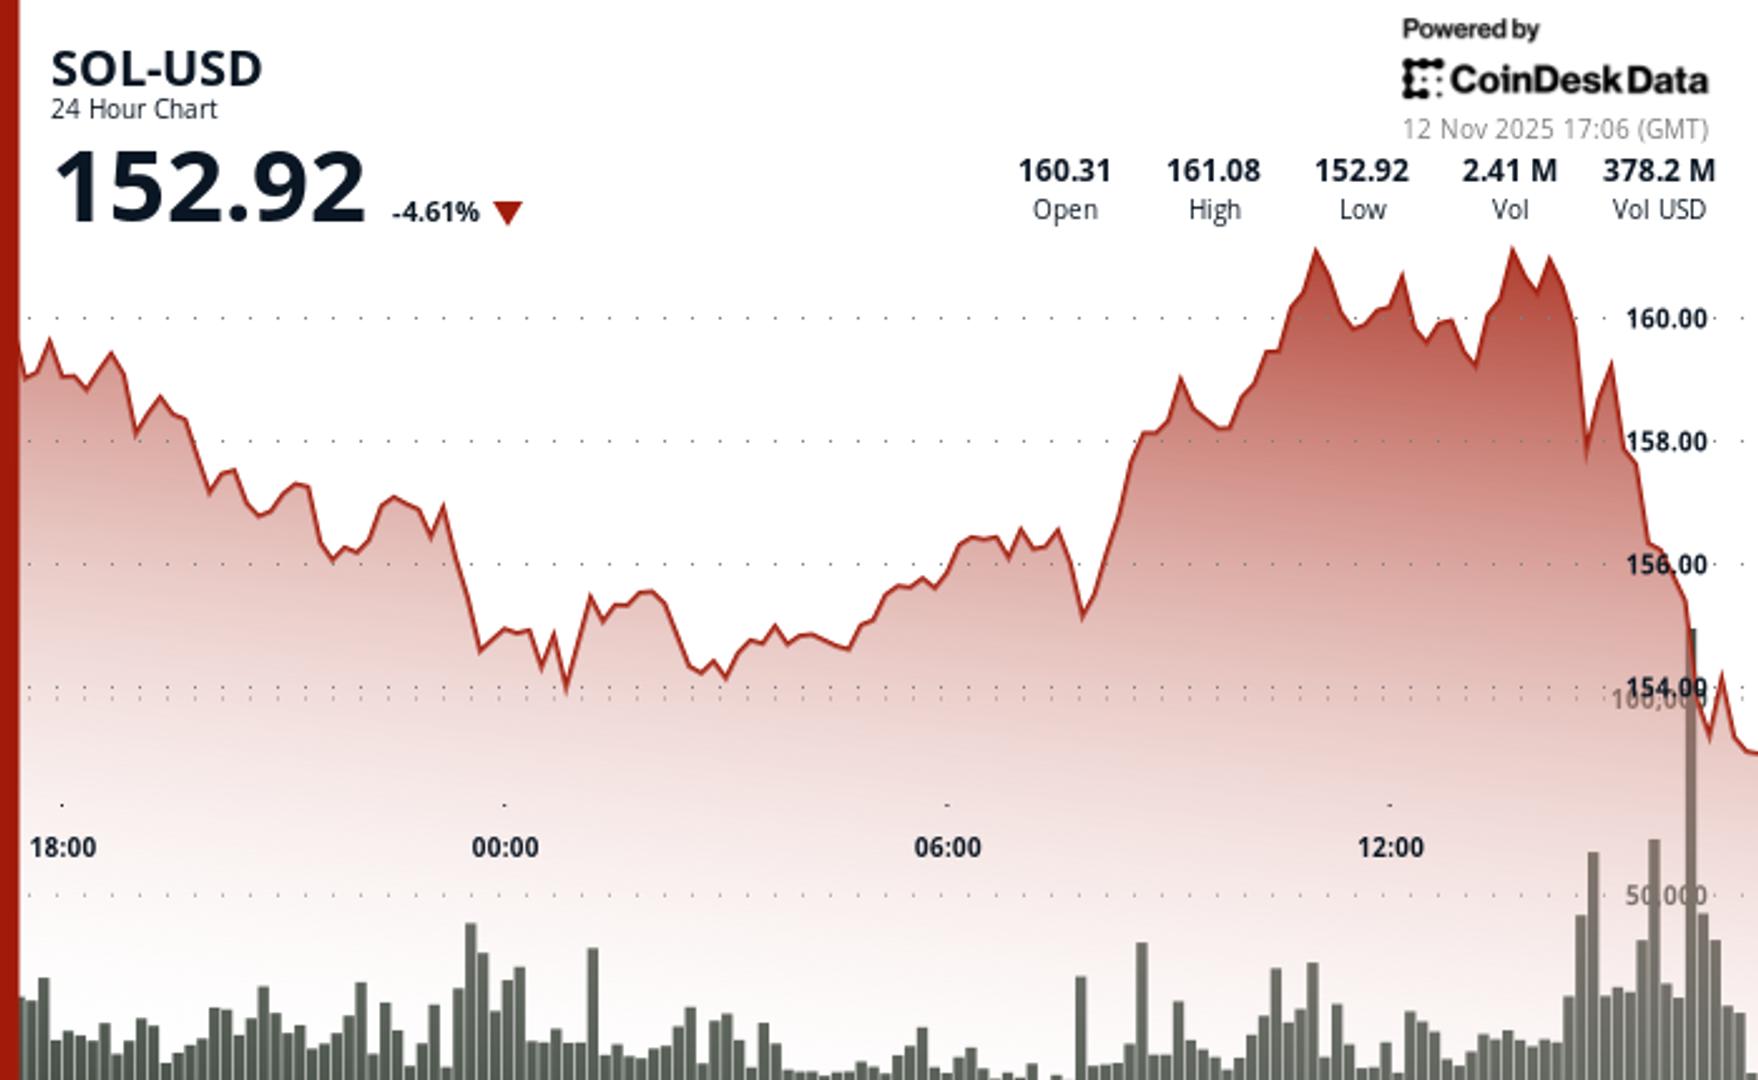
Solana faces renewed selling pressure as the token tumbles from $160.72 to $152.81, posting a 4.9% decline despite continued institutional support through exchange-traded fund products. The drop occurs on elevated volume running 17.25% above the seven-day average. Active repositioning dominates rather than passive drift.
Selling intensifies following another scheduled token unlock from bankrupt Alameda Research and the FTX estate on November 11. Analyst MartyParty reports approximately 193,000 SOL tokens worth $30 million get released as part of ongoing monthly vesting. The program has been gradually distributing over 8 million tokens since November 2023. These structured releases, managed under bankruptcy oversight, typically flow to major exchanges for creditor repayment.
Institutional demand remains robust with solana spot ETFs recording their tenth consecutive day of inflows totaling $336 million for the week. Major financial institutions including Rothschild Investment and PNC Financial Services disclosed new holdings in Solana-based products. Grayscale introduced options trading for its Solana Trust ETF (GSOL) to provide additional hedging tools for institutional traders.
Supply Pressure vs Institutional Demand: What Traders Should Watch
Alameda’s systematic token releases create predictable selling pressure while institutional flows provide underlying support. SOL finds itself caught between opposing forces. The bankruptcy estate maintains approximately 5 million tokens in locked or staked positions. Smaller monthly unlocks continue through 2028 based on pre-2021 investment agreements.
The 60-minute analysis reveals accelerating bearish momentum as SOL breaks critical support at $156 amid explosive selling volume. The breakdown occurs during 15:00-16:00 UTC when price collapses from $155.40 to $152.86 on 212,000 volume—123% above the hourly average.
This technical failure confirms the earlier support breach and establishes a descending channel targeting the $152.50-$152.80 demand zone. However, underlying strength in ETF flows suggests institutional accumulation at lower levels. Bitwise’s BSOL leads weekly inflows with $118 million while maintaining its yield-focused strategy through staking rewards averaging over 7% annually.
Key Technical Levels Signal Consolidation Phase for SOL
Support/Resistance: Primary support establishes at $152.80 demand zone with secondary levels at $150; immediate resistance at $156 (former support) and $160
Volume Analysis: 24-hour volume surges 17% above weekly average during breakdown, confirming institutional repositioning rather than retail capitulation
Chart Patterns: Descending channel formation with lower highs at $156.71 and $156.13; break above $160 needed to invalidate bearish structure
Targets & Risk/Reward: Bounce potential toward $160-$165 resistance if $152.80 holds; breakdown below $150 accelerates toward $145 support levels
CoinDesk 5 Index (CD5) Drops 1.85% in Volatile Session
CoinDesk 5 Index fell from $1,792.49 to $1,759.24, declining $33.25 (-1.85%) across a $74.31 total range as strong bearish momentum emerges after failing resistance at $1,824.82, with significant institutional volume during the 15:00-16:00 selloff confirming the downward break below key support at $1,767.
Disclaimer: Parts of this article were generated with the assistance from AI tools and reviewed by our editorial team to ensure accuracy and adherence to our standards. For more information, see CoinDesk’s full AI Policy.


