ETH trades at $3,473 after gaining 1.69% today, but prediction markets tell conflicting stories about what’s next.
Bulls point to $6.4 billion in recent whale accumulation and strong fundamentals.
But several technical indicators suggest downside is more likely.
As the crypto market loses steam, and the price of Bitcoin falls to lows not seen since early summer, traders are eyeing up alternative assets: Where does the price of Ethereum, the second-largest crypto asset by market, go next?
Ethereum, which trades as ETH, opened today at $3,415.8 and has climbed to $3,473.2—a modest 1.69% gain that’s doing little to ease the tension around where ETH heads next. Prediction markets tell differing stories, and the charts suggest one of narratives may be suffering from some serious hopium.
On Myriad, a predictions market built by Decrypt’s parent company Dastan, users have placed 65% odds on Ethereum pumping to $4,000 before dumping to $2,500. On a separate market on Myriad, though, users say there’s a 79.1% chance ETH won’t make it to $5,000 by year’s end. That might seem like a disconnect, but it’s a reflection of how much momentum the crypto market has lost in just the past couple months.
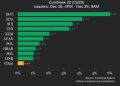
Bitcoin dominance has surged to 60%, meaning BTC has gained a 60% market share over competing assets, creating a “Bitcoin Season” that suffocates altcoins. The Fear & Greed Index sits at 24, firmly in fear territory and down from 38 a month ago.
Typically, what Bitcoin does altcoins follow. And when prices go down, Bitcoin tends to be the more predictable, stable option. Traders, then, will “hedge” from the risk of more volatile assets (think Dogecoin, Solana, or even meme coins), and set their eyes on more stable options like Bitcoin, stocks, or commodities.
So is Ethereum on a path to a new moon or doom? Prediction markets are split, but maybe these charts can help:
Ethereum (ETH) price: What the charts say
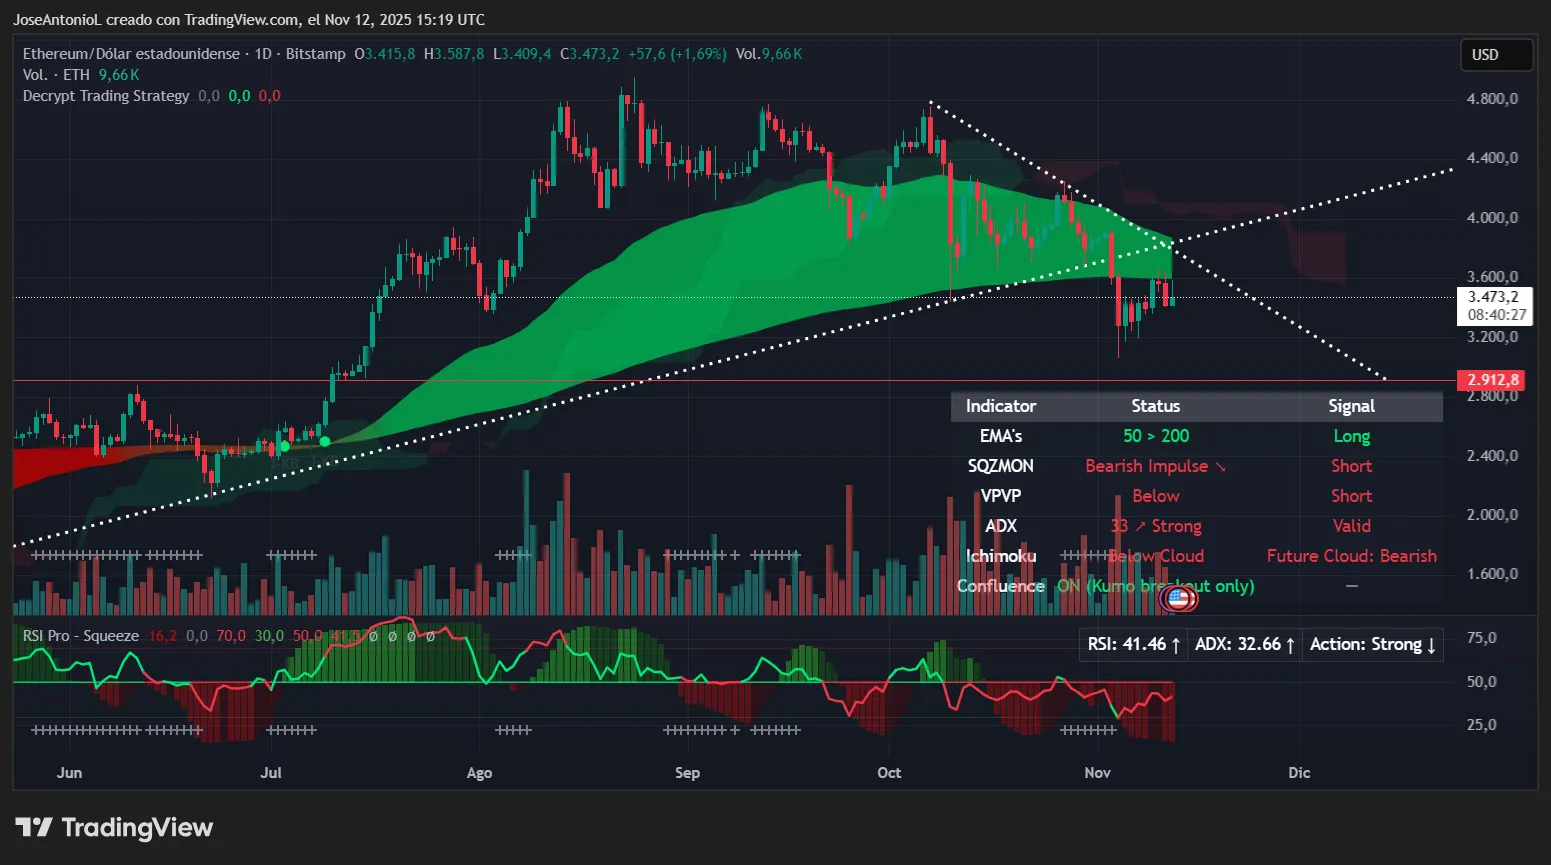
Ethereum has been grinding lower over the past few weeks after failing to hold above $3,800 in late October. The daily chart shows price caught between a descending resistance trendline from October’s $4,800 highs and an ascending support trendline that was in place throughout most of 2025.
Right now, ETH is testing a support zone at $3,400, with a lot of volume in play. It rejected a major dip back in October and was the bounce zone after a correction in early August.
Ethereum price data. Image: Tradingview
The Relative Strength Index, or RSI, measures market momentum on a scale from 0 to 100. ETH’s RSI sits at 41.46—firmly in bearish territory. Below 50 means selling pressure dominates, and at 41, there’s still plenty of room to fall before becoming oversold enough (reaching 30 or below) to attract bargain hunters.
The Average Directional Index, or ADX, measures trend strength regardless of direction. Readings above 25 confirm a strong trend is in place, while below 20 signals choppy, directionless action. ETH’s ADX sits at 32.66—well into “strong trend” territory. Here’s the problem: The trend is bearish, and this indicator suggests there’s some conviction behind it.
Exponential Moving Averages, or EMAs, track average prices over different timeframes to identify trend direction. When the shorter 50-day EMA trades above the longer 200-day EMA, it typically signals the long-term uptrend remains intact, forming a “golden cross” pattern.
Ethereum currently maintains this bullish setup—the only bright spot for bulls right now. However, the current price of ETH sits below both EMAs, suggesting short-term weakness despite the longer-term bullish structure. And the closing gap between these two hints at a potential “death cross” (the opposite of the golden cross) to come—which is a solid bearish indicator.
Why the bullish case could work
Myriad placing 67% odds on ETH hitting $4K isn’t crazy.
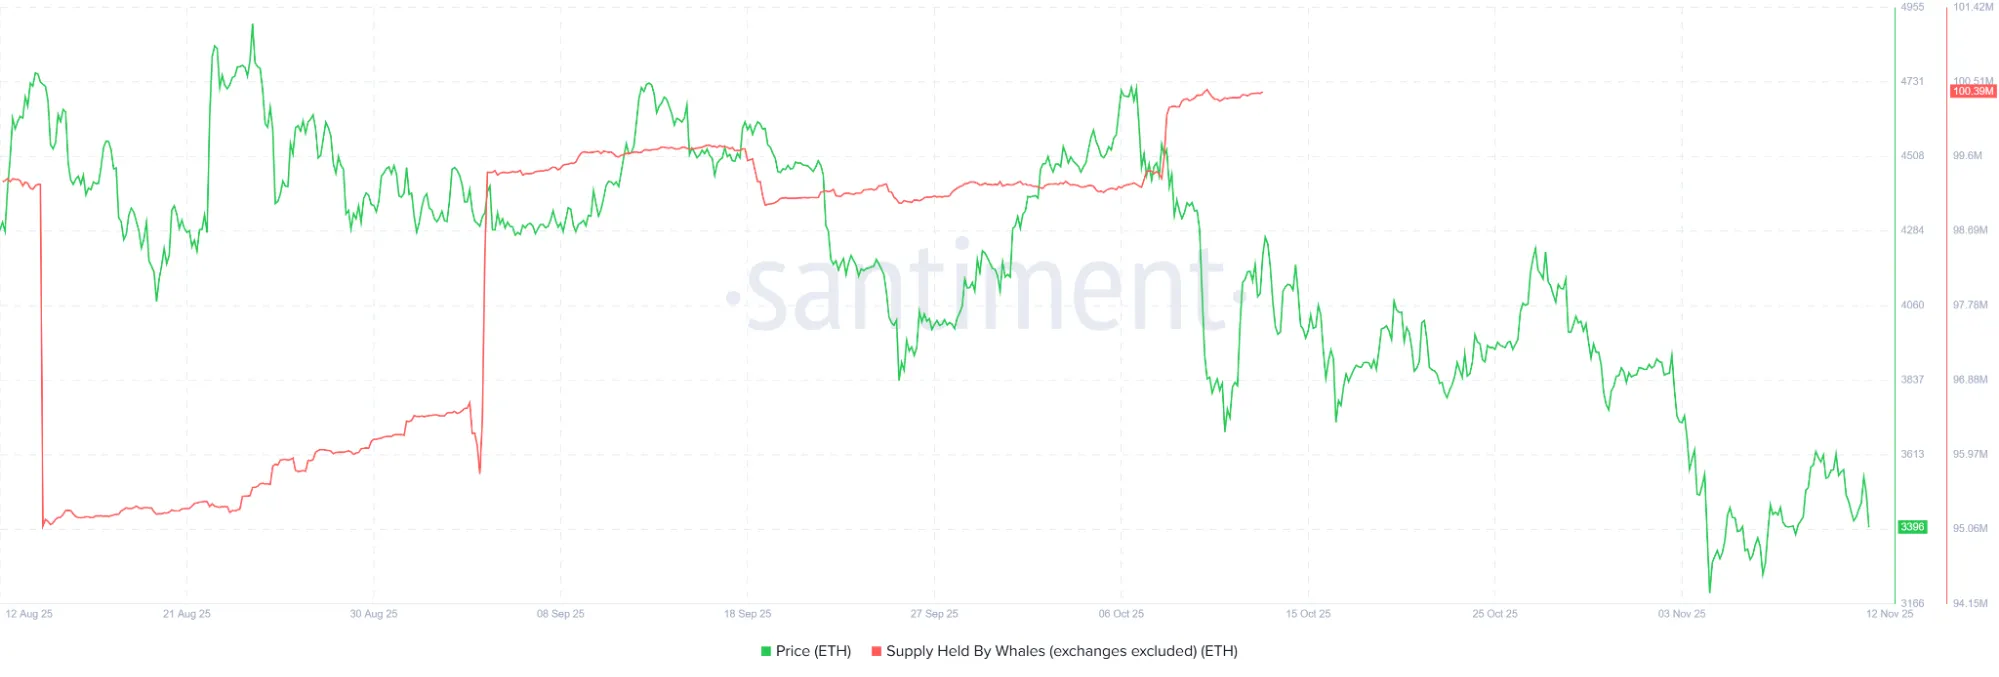
There’s some fundamental support building. Whales accumulated 1.64 million ETH in October—worth about $6.4 billion at current prices—despite a 7% monthly drop in the price of ETH.
Ethereum token accumulation. Image: Santiment
Also, the upcoming Fusaka upgrade for Ethereum on December 3 will dramatically improve scalability, which is welcomed news for the ETH maxis.
For the pump to $4K to materialize, ETH needs to break through the descending resistance trendline around $3,600-$3,800. If bulls can punch through that ceiling decisively, the path to $4,000 opens up. The golden cross EMA setup provides a bullish foundation that could support a rally if macro conditions improve—say, if the Fed signals dovish intentions or Bitcoin consolidates enough to allow an altcoin season.
Why the bearish case is more likely
Here’s where it gets uncomfortable for bulls. Multiple independent indicators are aligning on bearish signals, and when that happens, traders listen.
The Squeeze Momentum Indicator identifies periods of low volatility (the “squeeze”) that typically precede explosive moves. When the squeeze “fires” or releases, it signals which direction that explosive move will go. ETH’s squeeze shows “bearish impulse,” releasing downward right now—like a compressed spring uncoiling straight down. This is the same setup that preceded Bitcoin’s recent drop from $108K, and now trading for just below $102K.
The Volume Profile Visible Range, or VPVP, shows where the most trading volume occurred. When price trades below the point of control (highest volume zone), it means sellers are in control. Traders who bought higher are now underwater and often become motivated sellers, adding to downward pressure. ETH is currently below this control zone.
Chart structure shows trouble for bulls. The price of ETH is testing the lower support at $3,400 right now. When triangles break with this kind of momentum, they break hard. The bearish trendline from October provides strong overhead resistance around $3,600-$3,800, creating a formidable ceiling.
Bears have the edge
Whale accumulation is real and the EMA setup is technically bullish, but let’s be honest about what the charts are saying right now.
The bearish alignment is too strong: ADX confirming downtrend strength at 32.66, RSI showing selling pressure at 41, Ichimoku structure bearish both current and forward, squeeze releasing downward, and VPVP below control. When five independent indicators tell the same story, the probability matrix clearly favors one outcome.
That Myriad prediction market showing 79.1% odds ETH doesn’t hit $5K in 2025? That’s probably the more realistic read on the situation.
The most likely path: a test and break of $3,400 support within the next few days, followed by a grind toward the $2,800-$2,500 zone where the ascending support trendline and 200-day EMA could finally provide a floor. That’s a 19-28% drop from here—painful, but not catastrophic in crypto terms.
Those whales who bought $6.4 billion in October aren’t flipping this next week. They’re positioning for Q1 2026 recovery—after the market flushes out weak hands first. Sometimes the market needs to reset before it can rally, and right now, gravity has the edge.


