Bitcoin and Ethereum are back in a downtrend following the Fed’s rate cut.
Technical indicators are flashing bearish signals across both assets.
Despite the selloff, prediction markets remain surprisingly optimistic.
The crypto market isn’t buying what the Fed is selling. Despite the Federal Reserve delivering its widely expected 25-basis-point rate cut to the 3.5%-3.75% range on Wednesday, Bitcoin and Ethereum are both in the red, with the broader crypto market sitting at $3.07 trillion—down 2.25% from yesterday.
While traditional markets rallied on the news, crypto took a different path. The S&P 500 closed up 0.67% and the Nasdaq gained 0.42%, but digital assets hemorrhaged value. The disconnect may suggest traders are reassessing future liquidity conditions despite lower borrowing costs.
Around 90% of the crypto market is bleeding red today, according to CoinMarketCap data, with some near the top 10 by market cap suffering double digit losses.
So what’s happening under the hood? Let’s break down what the charts are telling us:
Bitcoin (BTC) price: Downtrend still in play
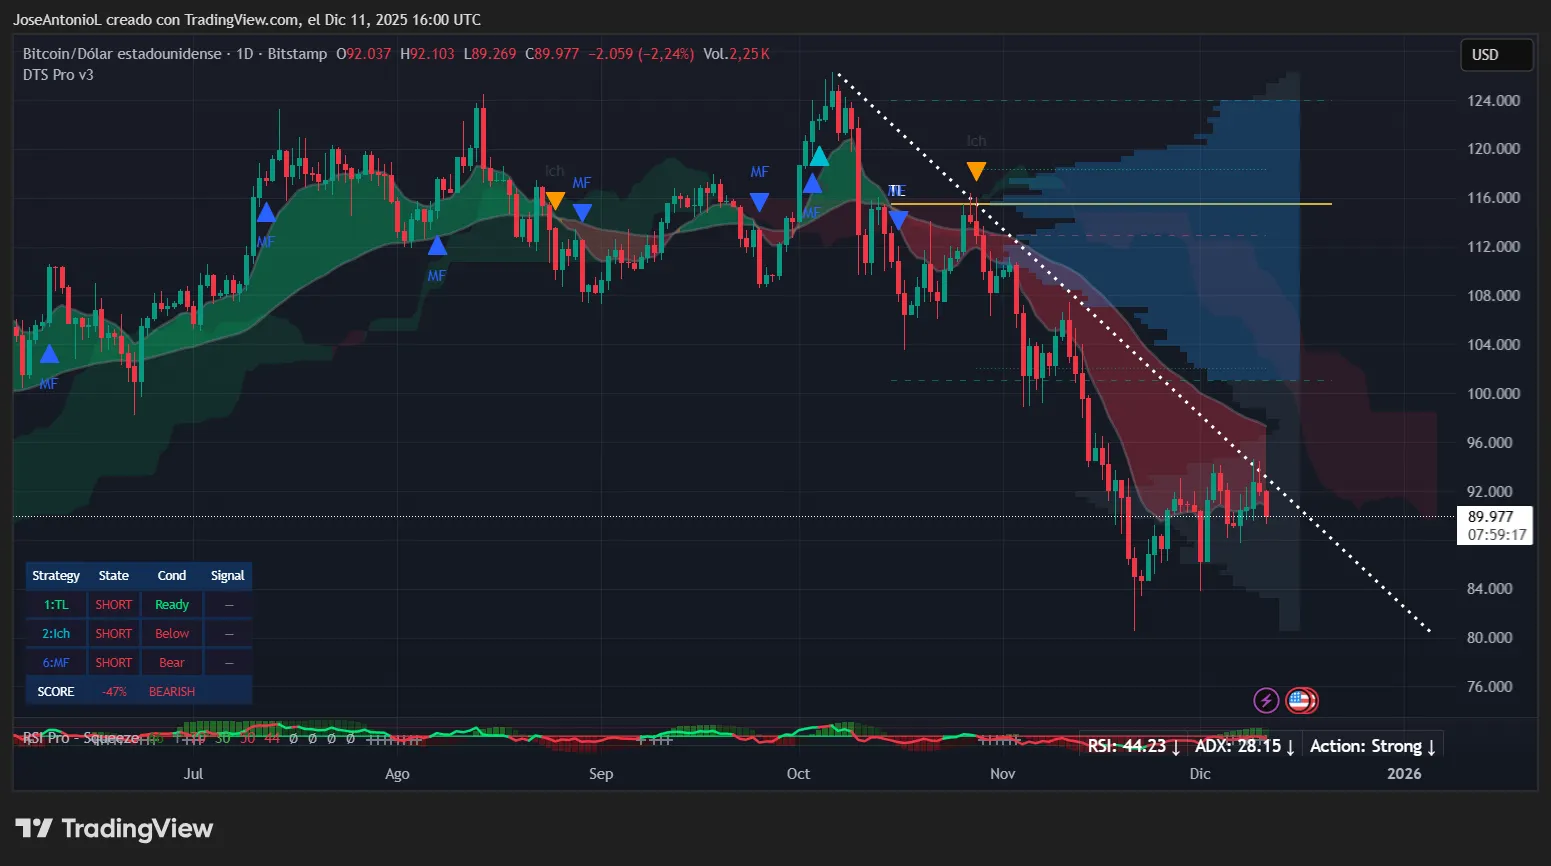
Bitcoin is trading at $89,977, down 2.24% over the past 24 hours. The price reached a high of $92,103 before sellers stepped in, pushing BTC back toward the psychologically critical $90,000 and confirming our previous analysis: This recent bounce wasn’t a trend reversal and could be just a spike within a broader bearish movement.
Price action continues to respect the descending trendline that’s been in place since the October peak around $126,000. That peak now feels like a distant memory as Bitcoin struggles to hold psychological support at $90K.
Bitcoin (BTC) price data. Image: Tradingview
Let’s talk technicals: Bitcoin’s relationship with its exponential moving averages, or EMAs, shows a price movement still in death cross territory. EMAs take the average price of an asset over the short, medium, and long term and help traders identify trend direction by smoothing out this price action.
When the faster moving 50-day price average crosses below the slower 200-day average, that forms what traders refer to as a death cross pattern, and it typically signals bearish momentum.
Right now, Bitcoin is trading well below the average price of the past 50 and 200 days. BTC’s upward move recently was rejected as it moved past the 50-day EMA and couldn’t break the descending trendline around $100,000.
The Relative Strength Index, or RSI, sits at 44.23. RSI measures momentum on a scale from 0 to 100, with readings below 50 indicating more selling pressure than buying. At 44, Bitcoin isn’t oversold enough to attract aggressive bargain hunters, but it’s clearly in bearish territory. Traders typically watch for RSI to dip below 30 (deeply oversold) before betting on a bounce.
The Average Directional Index—ADX for short—measures trend strength regardless of direction. Readings above 25 signal that a trend is real and has legs; below 20 means the market is directionless. Bitcoin’s ADX at 28.15 confirms this downtrend is strong and sellers are in control.
Bitcoiners, though, still seem to be pretty bullish, all things considered. On Myriad, a prediction market created by Decrypt’s parent company Dastan, 69% of the money betting on Bitcoin’s next move are holding the bullish line: Most Myriad traders still believe it’s more likely BTC reaches $100K before dropping to $69K.
Even more telling: The Myriad market that questions whether “Crypto Winter is coming” has traders placing 90% odds on “no.” Translation: traders are getting shaken out by volatility, but longer-term conviction remains surprisingly strong.
Ethereum (ETH) price: Bulls are in a fight
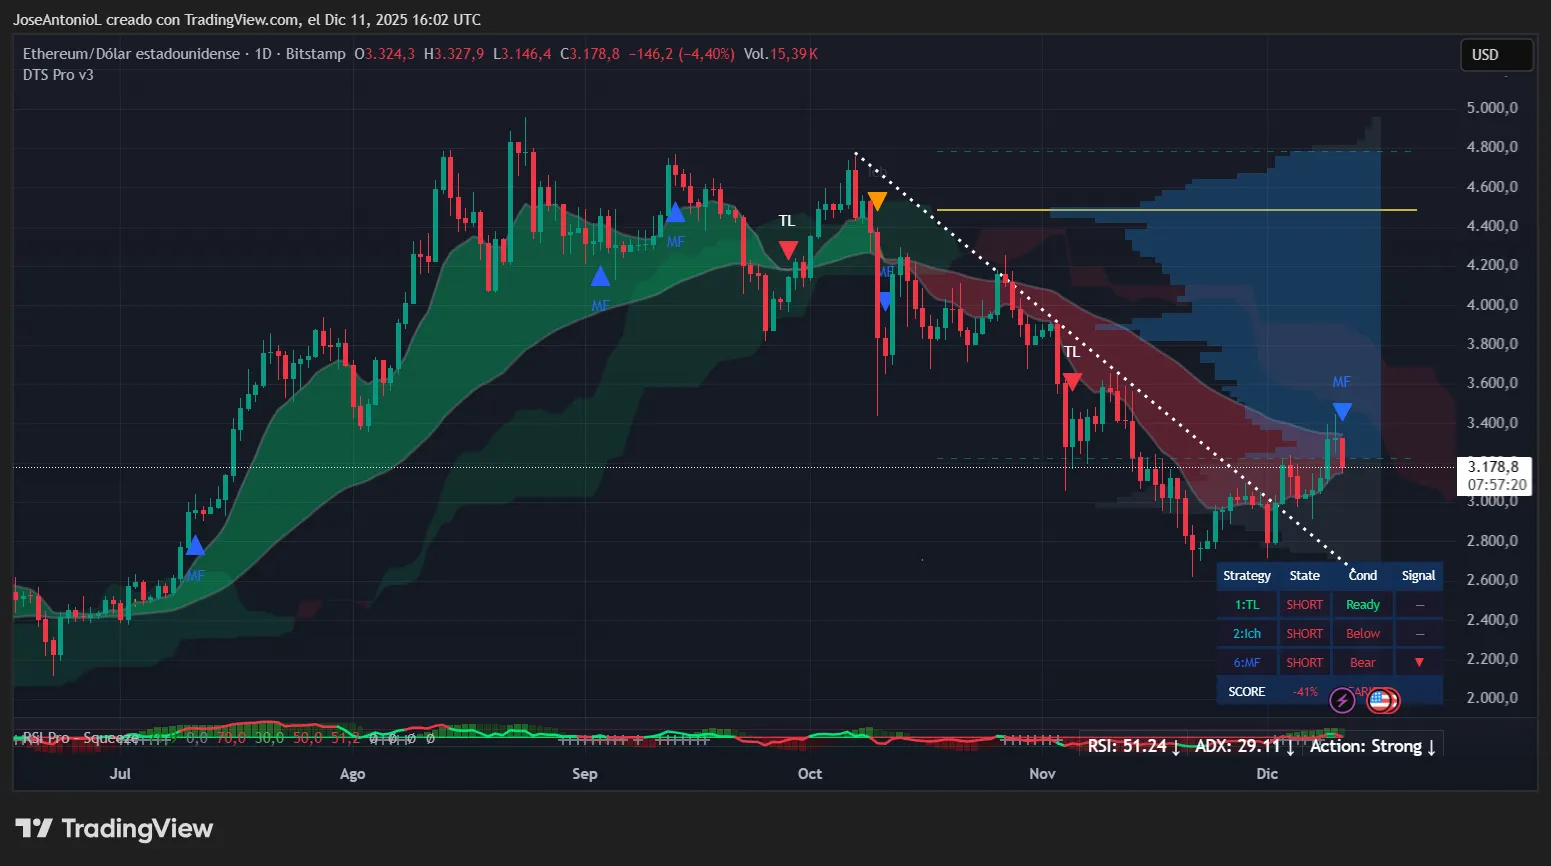
Ethereum is having an even rougher go of it, down 4.40% to $3,178.8 today. The second-largest cryptocurrency by market cap opened at $3,324.3 and proceeded to lose around $146.2 through the session, touching a low of $3,146.4 before stabilizing slightly.
Ethereum (ETH) price data. Image: Tradingview
Ethereum’s move nearly set up a golden cross scenario—the inverse of a death cross—but it failed.
Unlike Bitcoin, ETH was able to break its immediate resistance (the dotted white line in the chart above) and even the EMA50 but couldn’t push past the EMA200 line. That’s a problem. It suggests that even though Ethereum briefly showed strength, the longer-term bearish structure remains intact. For a golden cross to form and hold, you need a clean break above the 200-day EMA followed by several closes above it. We didn’t get that.
The RSI for Ethereum reads 51.24—technically neutral territory but barely. This is the crypto equivalent of a coin flip: Neither bulls nor bears have a decisive advantage based on momentum alone. Traders usually consider RSI above 70 as overbought (time to take profits) and below 30 as oversold (time to buy dips). At 51, Ethereum is stuck in no man’s land.
Like Bitcoin, many of Ethereum’s technical strategies are aligned with a short setup with a -41% bearish score. The Ichimoku cloud is red and expanding, price is following a descending channel, and volume profiles show most trading activity concentrated at higher levels—meaning many holders are underwater.
What’s interesting is, once again, the disconnect between price action and prediction markets. On Myriad, sentiment is shifting cautiously bullish. The market asking traders to predict Ethereum’s next move—a pump to $4K or a dump to $2.5K—now shows 50-50 odds—a dramatic shift from late November when 90% of money was betting on $2.5K.
Disclaimer
The views and opinions expressed by the author are for informational purposes only and do not constitute financial, investment, or other advice.
Daily Debrief Newsletter
Start every day with the top news stories right now, plus original features, a podcast, videos and more.


