

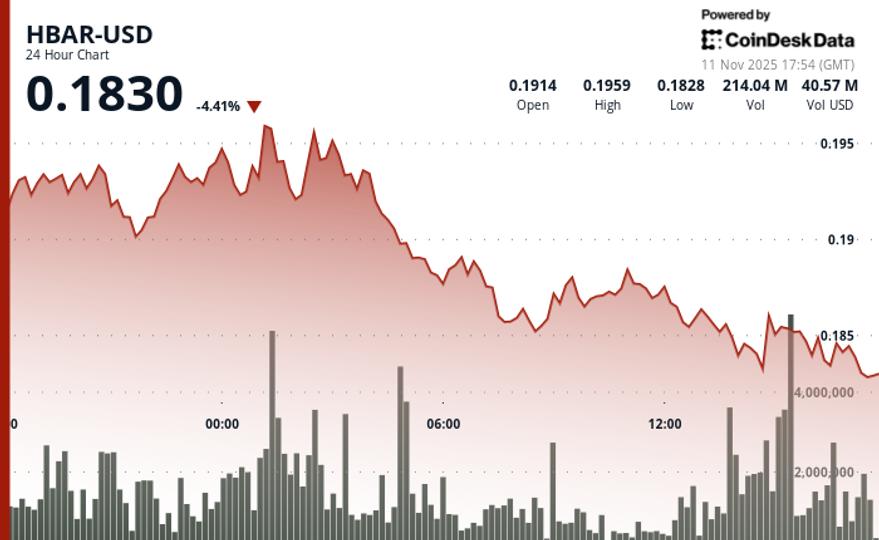
HBAR declined 2.1% to $0.1837 during Tuesday’s session as the cryptocurrency faced rejection at key resistance levels near $0.1940.
The token initially posted modest gains of 1.09% to $0.1842, trading on volume 8.23% above its weekly average, before sellers emerged in the final hours.
The reversal pattern developed as HBAR tested resistance around $0.1885 early in the session, then broke lower through consolidation support between $0.1840-$0.1870.
Volume spiked to 142.7 million tokens during the breakdown, marking a 95% increase above the 24-hour average of 73.2 million and confirming institutional selling pressure.
With HBAR having failed at resistance and broken through consolidation zones, technical levels dominated price action as volume patterns confirmed selling pressure. The 95% volume surge during the breakdown from $0.1885 signaled institutional distribution rather than retail profit-taking.

Key Technical Levels Signal Further Weakness for HBAR
- Support/Resistance: Critical support holds at $0.1831 after multiple successful tests; broken support at $0.1842 now acts as immediate resistance with major resistance remaining at $0.1940 rejection level
- Volume Analysis: Breakdown volume of 142.7M shares exceeded 24-hour SMA by 95%, confirming institutional selling; elevated activity at $0.1885 resistance marked distribution zone
- Chart Patterns: Lower highs pattern from $0.1967 peak intact; breakdown from $0.1840-$0.1870 consolidation zone validates bearish structure with momentum accelerating lower
- Targets & Risk/Reward: Next downside target at $0.1820 if $0.1831 support fails; recovery requires reclaim of $0.1842 broken support and sustained move above $0.1870 consolidation high
Disclaimer: Parts of this article were generated with the assistance from AI tools and reviewed by our editorial team to ensure accuracy and adherence to our standards. For more information, see CoinDesk’s full AI Policy.


